> ## Documentation Index
> Fetch the complete documentation index at: https://docs.dcdeploy.com/llms.txt
> Use this file to discover all available pages before exploring further.
# Logs
> View and search real-time logs for your workloads directly in the DCDeploy dashboard.
The **Logs** tab provides real-time visibility into the output of your running workloads.\
It is especially useful for debugging, monitoring application health, and investigating errors.
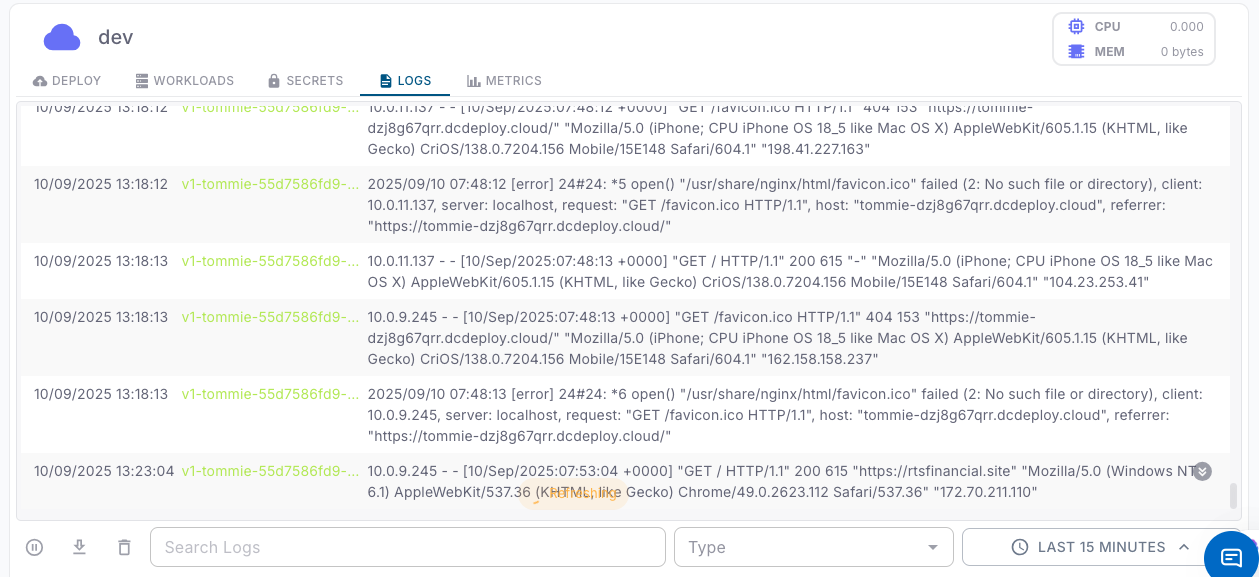 Each log entry contains:
* **Timestamp**: When the log line was generated.
* **Workload & Version**: Identifies which workload and version produced the log (e.g., `v1-tommie-...`).
* **Log Message**: The actual application or system output (e.g., HTTP requests, errors, warnings).
* **Client Details**: Includes client IP, user-agent, referrer, and request path.
You can narrow down the displayed logs using:
* **Time Range**: Select a window (e.g., *Last 15 minutes*, *1 hour*, *24 hours*).
* **Search Box**: Enter keywords, error codes, or paths to filter relevant log entries.
Use the **download button** (⬇️) to export logs for offline analysis or sharing with your team.
* Regularly monitor logs to identify unexpected errors early.
* Use search filters when debugging specific issues (e.g., `500`, `favicon.ico`, `POST /api/login`).
* Combine log analysis with the **Metrics tab** for deeper insights on performance bottlenecks.
* For production environments, integrate log shipping with external monitoring systems if needed.
Each log entry contains:
* **Timestamp**: When the log line was generated.
* **Workload & Version**: Identifies which workload and version produced the log (e.g., `v1-tommie-...`).
* **Log Message**: The actual application or system output (e.g., HTTP requests, errors, warnings).
* **Client Details**: Includes client IP, user-agent, referrer, and request path.
You can narrow down the displayed logs using:
* **Time Range**: Select a window (e.g., *Last 15 minutes*, *1 hour*, *24 hours*).
* **Search Box**: Enter keywords, error codes, or paths to filter relevant log entries.
Use the **download button** (⬇️) to export logs for offline analysis or sharing with your team.
* Regularly monitor logs to identify unexpected errors early.
* Use search filters when debugging specific issues (e.g., `500`, `favicon.ico`, `POST /api/login`).
* Combine log analysis with the **Metrics tab** for deeper insights on performance bottlenecks.
* For production environments, integrate log shipping with external monitoring systems if needed.