You can track CPU, Memory, Network, Storage usage, and response errors over a selected time window.
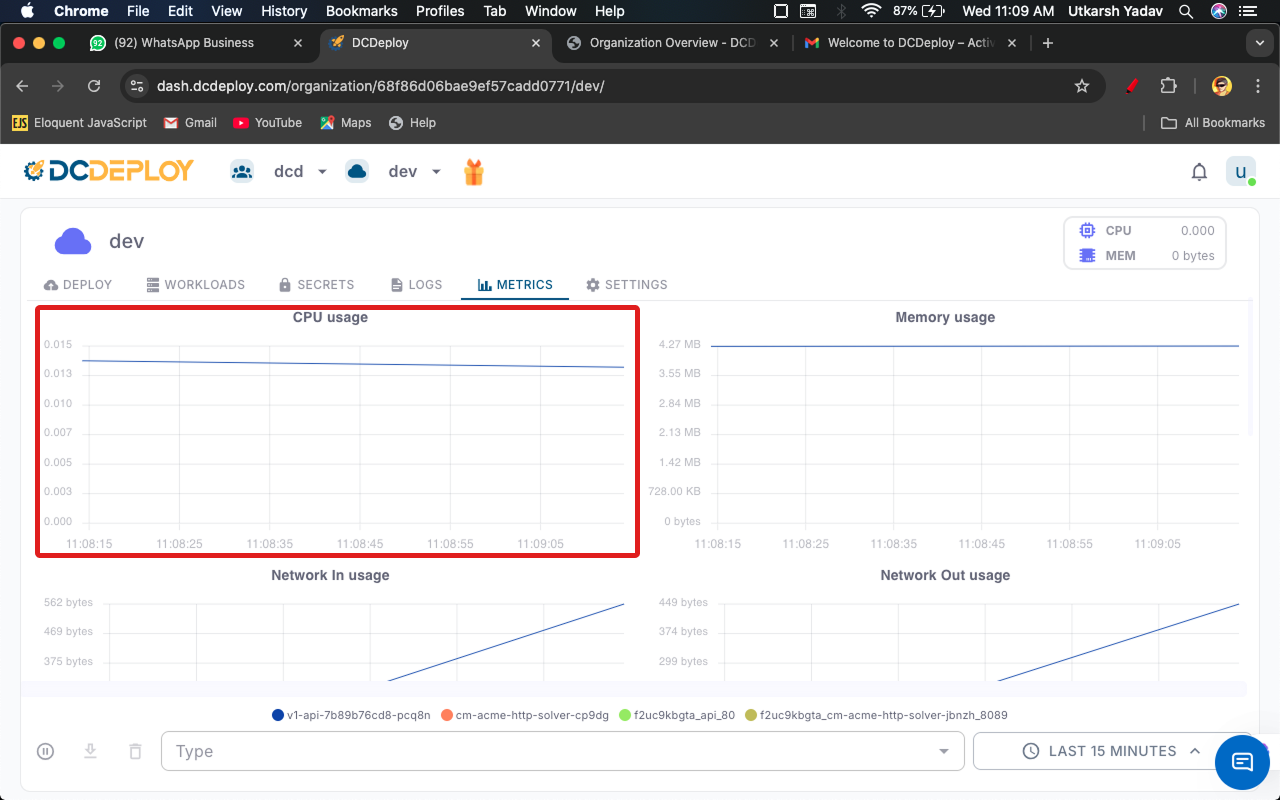
CPU Usage
Tracks how much CPU your workload is consuming over time.Helps you identify performance spikes or bottlenecks.
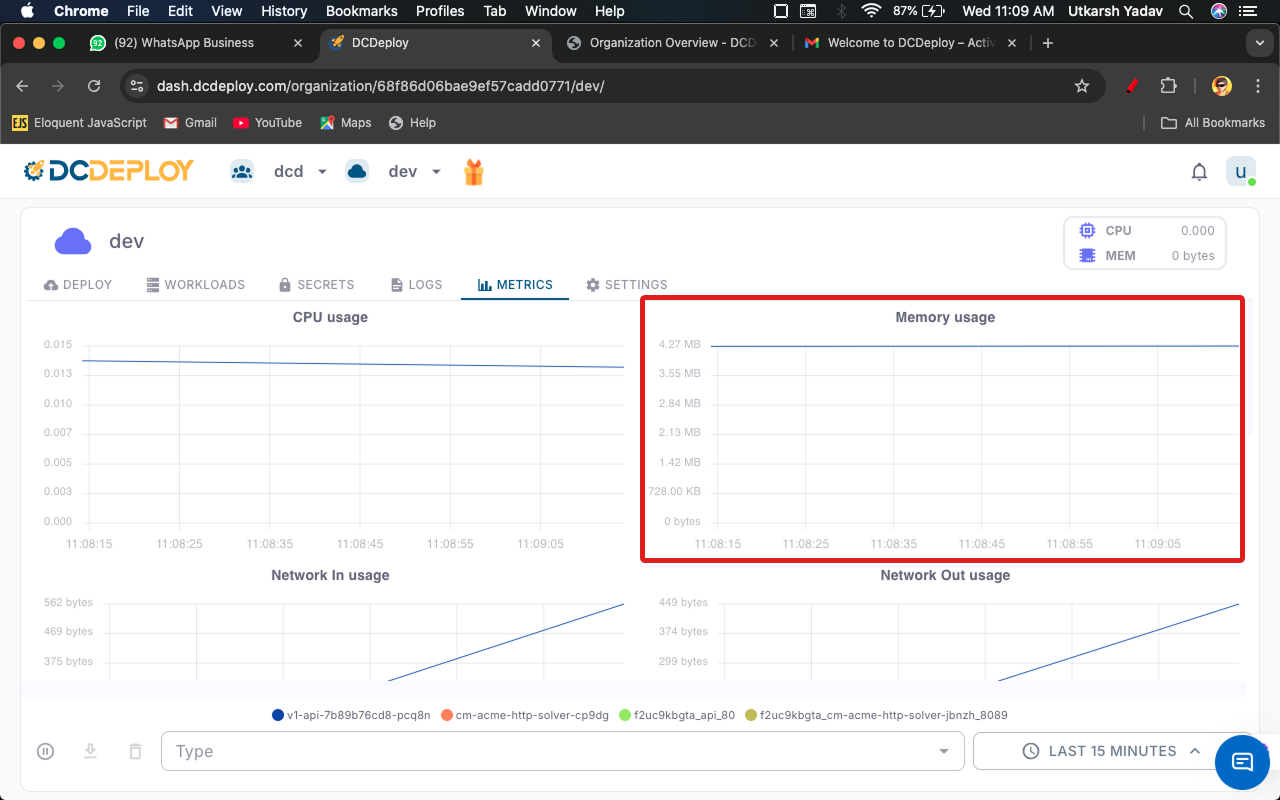
Memory Usage
Displays the memory consumption of your workloads.Useful for detecting memory leaks or unusual memory growth.
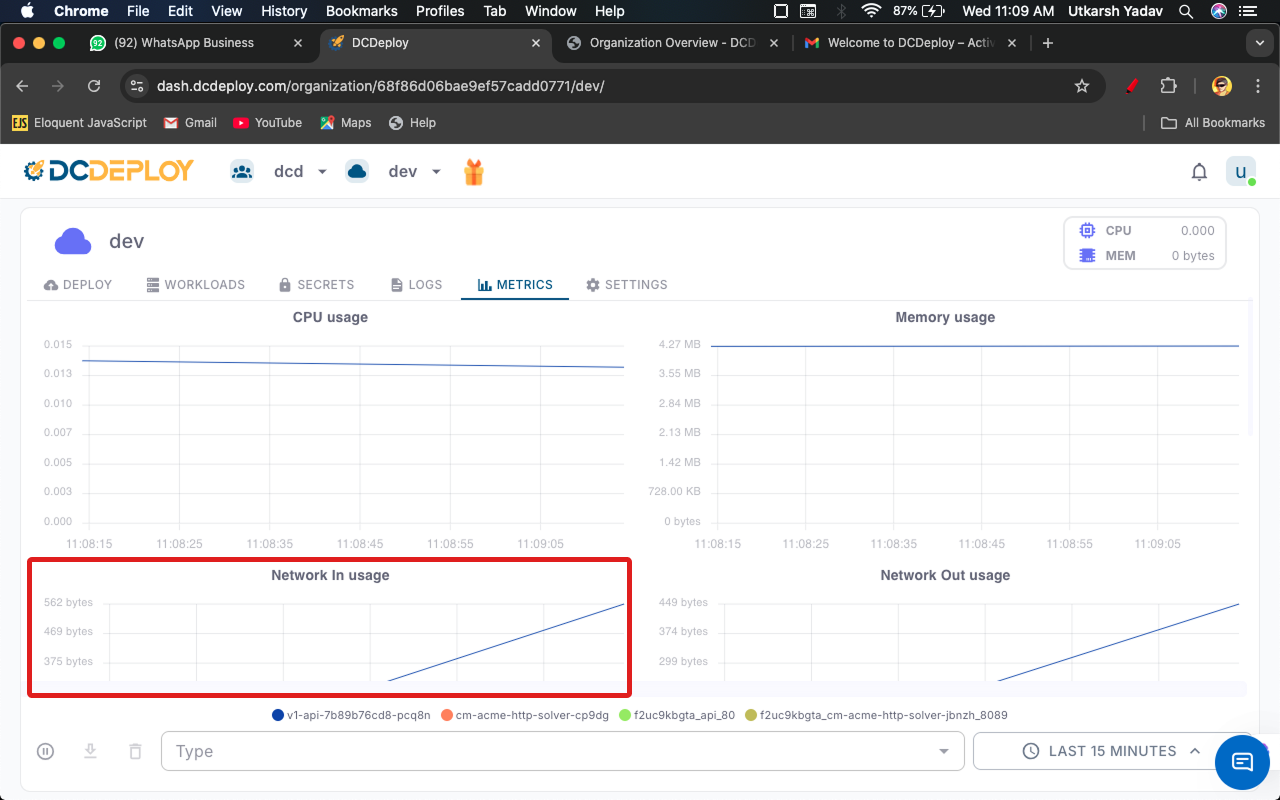
Network In Usage
Shows the amount of incoming traffic to your workloads (in bytes).Helps track request volume and data transfer rates.
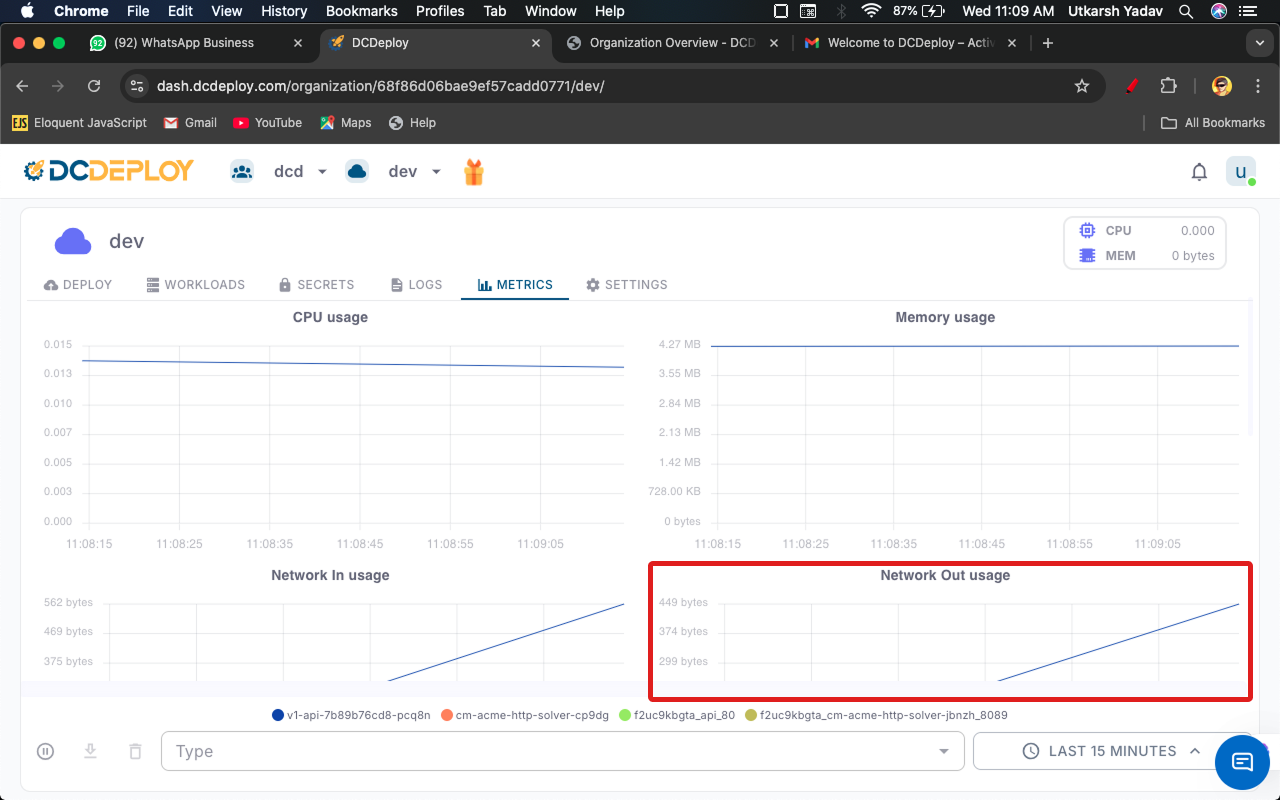
Network Out Usage
Shows the amount of outgoing traffic from your workloads (in bytes).Useful for monitoring external API calls or client responses.
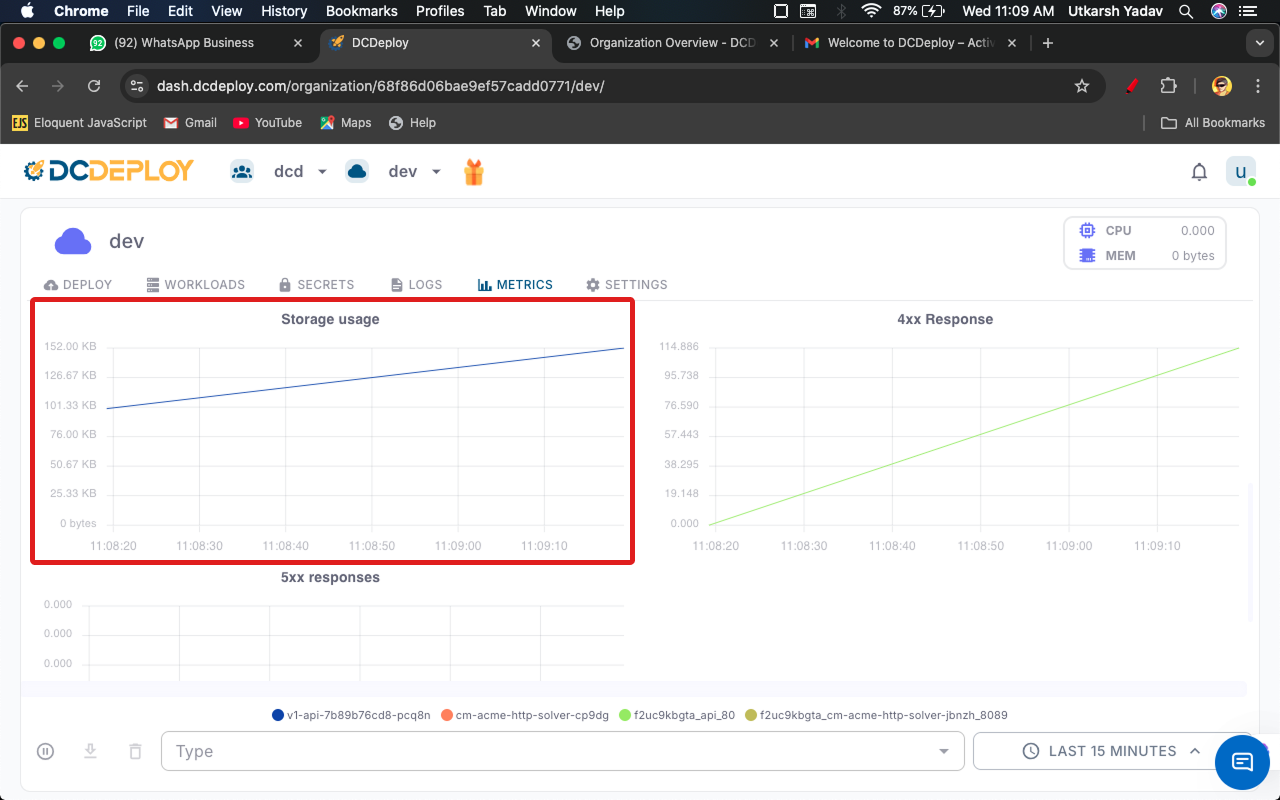
Storage Usage
Monitors how much storage your workload is consuming over time.Helps in preventing disk usage issues.
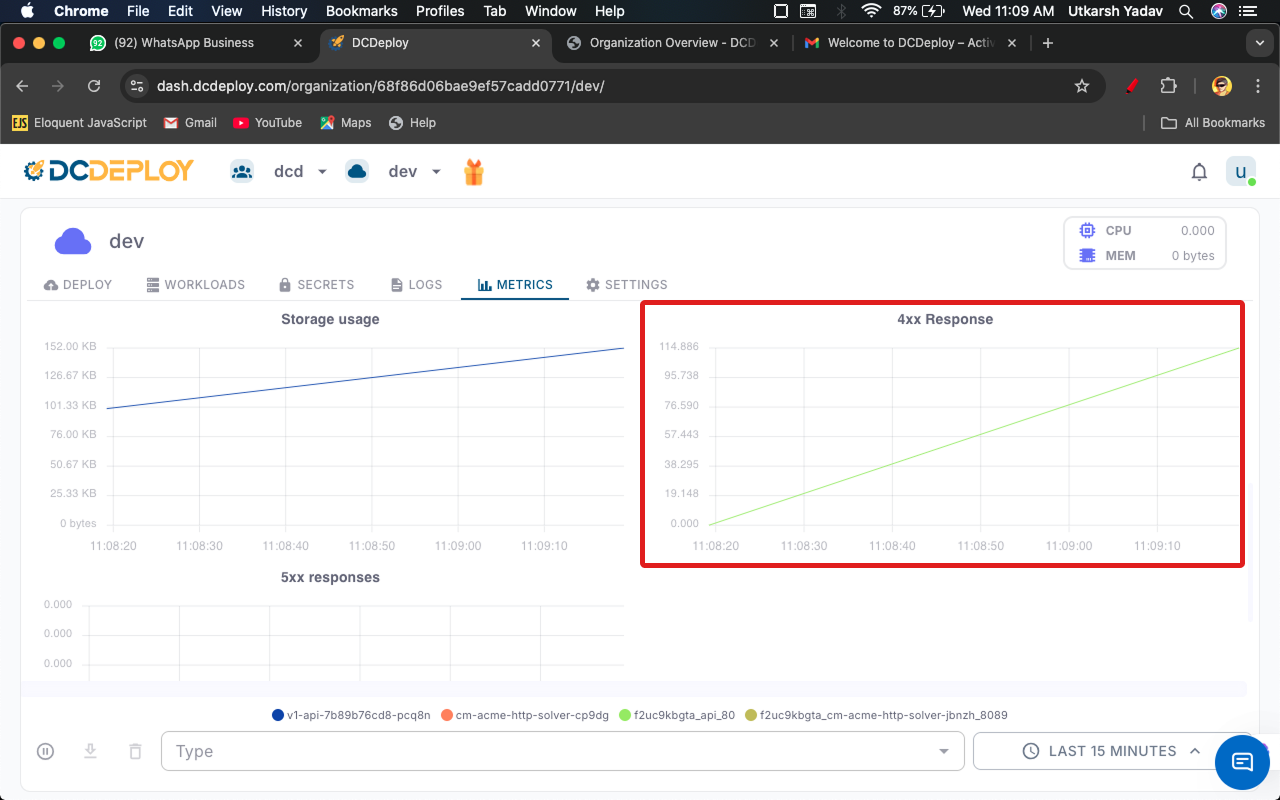
4xx Responses
Displays client-side errors (e.g., bad requests, unauthorized, not found).Helps detect incorrect API calls or misconfigured clients.
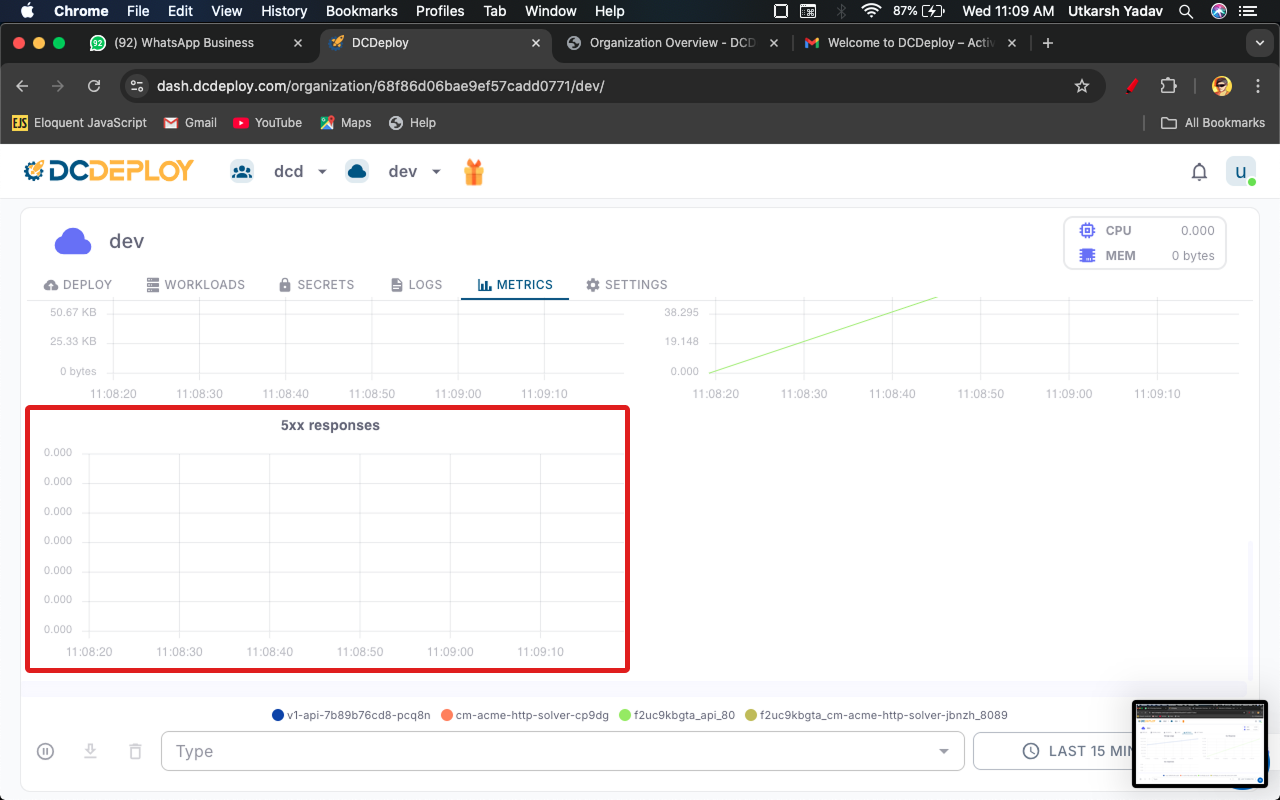
5xx Responses
Displays server-side errors (e.g., internal server errors, service unavailable).Useful for debugging backend or server-related issues.
Features
- Per Pod/Instance Breakdown → Metrics per pod/instance for deeper insights.
- Time Range Selector → Choose between last 15 min, 1 hr, 1 day, etc.
- Export & Filter → Download or filter metrics by workload type.