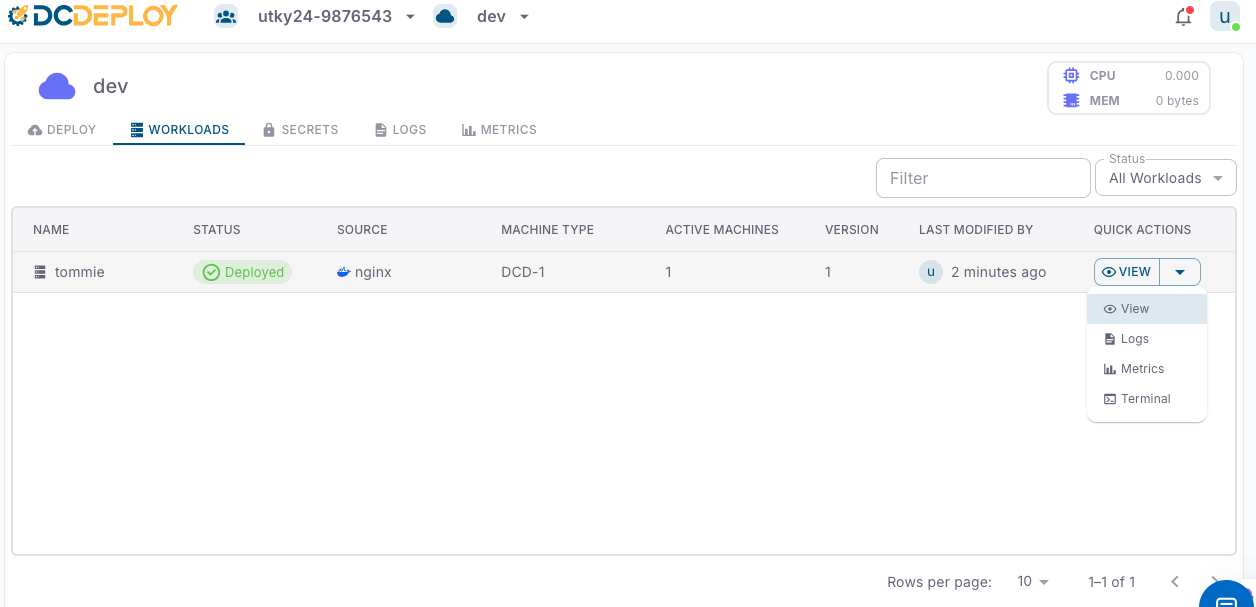
Workload overview
Each workload is listed with the following details:
- Name: The unique name of your service or database.
- Status: Current state of the workload (e.g., Created, Accepted, Buiding, Started, Pulled, Pulling, Deployed,Failed).
- Source: The origin of the workload (e.g., Docker image, GitHub public/private repo).
- Machine Type: The compute machine type allocated (e.g., DCD-2, DCD-3, etc..).
- Active Machines: Number of running instances for the workload.
- Version: The current deployed version.
- Last Modified By: The user who last updated the workload and timestamp of modification.
Filtering and searching
Use the Status filter or the search bar to quickly locate workloads by name or status.
Quick actions
The Quick Actions dropdown (⚙️ View) provides shortcuts to manage each workload:
- View: Inspect workload configuration and details.
- Logs: View real-time application logs for debugging and monitoring.
- Metrics: Analyze CPU, memory, and resource usage trends.
- Terminal: Access an interactive shell inside the running container for direct troubleshooting.